200-Day Moving Average (SMA200): Meaning, Signals – with Alerts by Wavealert
The 200-day moving average (also known as SMA200) is one of the most important trend indicators in technical analysis. It smooths short-term price fluctuations and shows the long-term trend based on the last 200 trading days.
Why the 200-day moving average matters
Looking at the SMA200 helps you quickly assess whether an asset shows long-term strength or weakness:
- Price above the 200-day moving average: often indicates a stable uptrend
- Price below the line: may point to a long-term downtrend
- Strong deviations: can highlight interesting entry or exit zones
Combined with the 50-day moving average (SMA50), you get a clear view of both short- and long-term market dynamics.
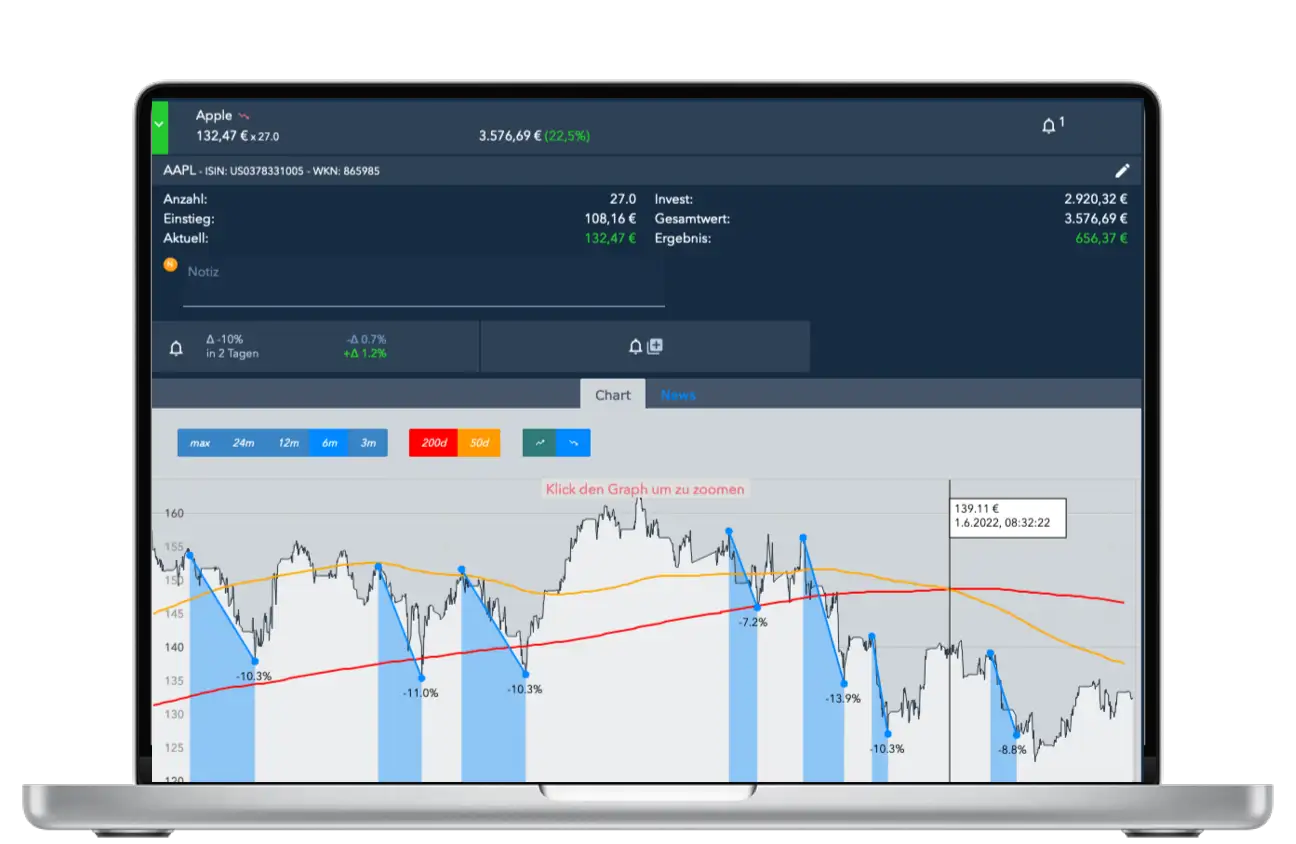
Display trend lines directly in the chart
In the detail view of each asset, you can display both trend lines – 50-day and 200-day – with a single click. This allows you to instantly see:
- how an asset develops over the long term
- which trend zones are currently being tested
- whether the lines act as support or resistance
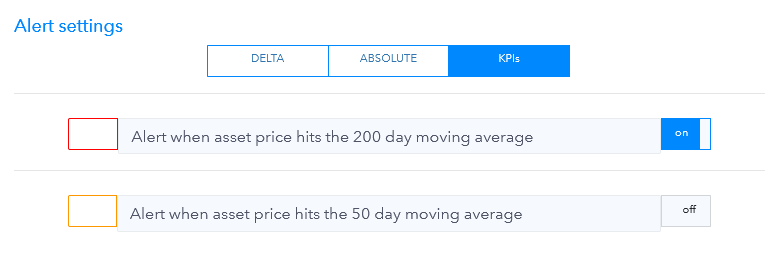
Alerts when the 50-day or 200-day moving average is crossed
Wavealert automatically notifies you when an asset moves above or below either of the two moving averages.
Benefits:
- no need to constantly monitor prices yourself
- never miss important market movements
- reliably automate rule-based strategies
Example:
You hold an ETF in your watchlist and only want to act once the long-term trend turns positive. By setting up an alert, you automatically receive an email with price data, relevant news, and your personal notes for that asset.
Frequently asked questions about the 200-day moving average
What is the 200-day moving average (SMA200)?
The 200-day moving average is the average price over the last 200 trading days. It is commonly used as a long-term trend filter in technical analysis.
What does price above or below the 200-day moving average mean?
When price trades above the SMA200, it is often interpreted as long-term strength. Trading below it is commonly seen as long-term weakness. Signals are more reliable when price stays above or below the line for several days.
Why is the 200-day moving average important?
Because many market participants watch it closely. The SMA200 helps quickly classify the long-term trend and often acts as a key support or resistance zone in price charts.
What is the difference between the 50-day and 200-day moving average?
The 50-day moving average (SMA50) reacts faster and reflects short- to mid-term price movements. The 200-day moving average (SMA200) reacts more slowly and represents the long-term trend. Used together, they provide a solid overview of momentum versus overall direction.
Perfect combinations with other features
- Stock Watchlist – monitor stocks and compare trends
- ETFs & ETCs – track long-term signals in index funds
- Cryptocurrencies – apply trendline alerts to crypto
- Community Alerts – discover signals that other users are watching
- Chart Alerts – full range of alerts for all assets
- News Analysis – read relevant news behind major moves
- Asset Notes – document your strategy for each asset
Register for free and create assets with alerts and notes tailored to your strategy.
More details about our fair pricing model can be found under Pricing.