Chart Alerts for All Assets – Technical Signals Without Constant Monitoring
With Wavealert, you can create unlimited alerts for every asset — whether it’s a stock, ETF, cryptocurrency, or physical precious metal. Alerts help you react quickly to meaningful price movements without monitoring charts all day.
Instantly see which assets have alerts
In your asset list, Wavealert shows:
- a bell icon for assets with active alerts
- the number of alerts set for each asset
- a red bell and highlighted row for currently triggered alerts
This makes it easy to identify where action is needed.
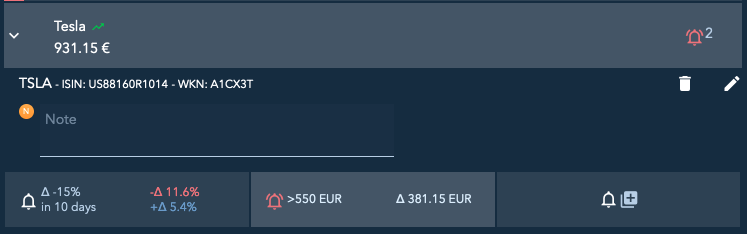
Detailed alert overview per asset
Inside the asset’s detail view, you'll see:
- what event each alert is monitoring
- whether the alert is currently active
- all relevant values and calculations
Absolute alerts compare the current price to your defined target.
Relative alerts measure positive or negative percentage changes across a chosen timeframe.
Relative change alerts (Delta)
This alert does not monitor the percentage change in a price on a single day, but rather the total change over several days. That's what makes it so special! Relative alerts track how much an asset moves over several days — the cumulative percentage change ("delta").
Example:
A stock drops 7% within just a few days.
Wavealert detects it early and notifies you immediately.
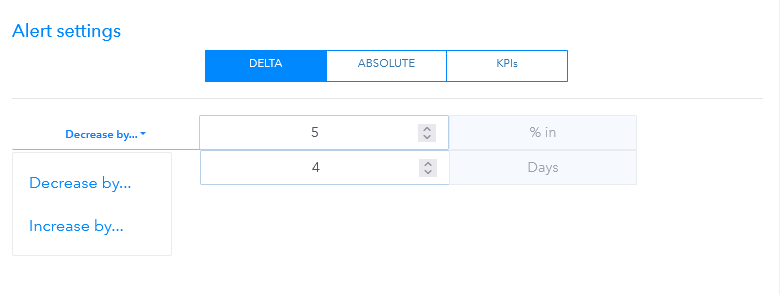
Further information and how to use this alarm strategically can be found in the section Delta Alert.
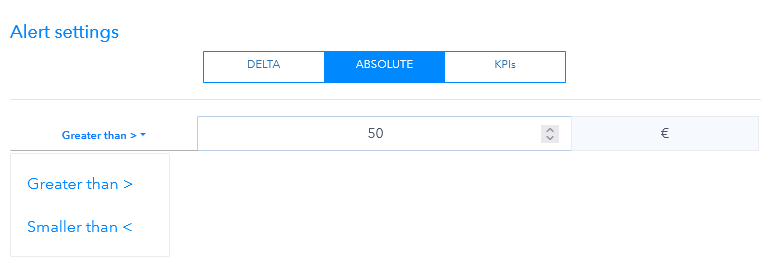
Absolute value alerts
These alerts trigger when the asset’s price rises above or falls below a specific value.
Example:
You want to be notified when an ETF climbs above $50 — perfect for timing your next move.
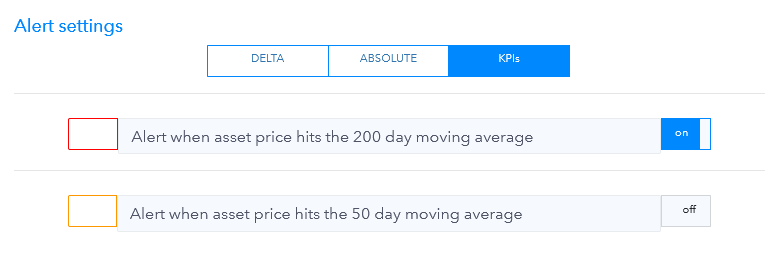
50-day & 200-day moving average alerts
Wavealert also supports trendline-based alerts.
When an asset crosses the 50-day or 200-day moving average, the alert triggers automatically.
Example:
A cryptocurrency moves above the 200-day line for the first time in months — Wavealert notifies you instantly.
Learn more under
200-Day Moving Average.
Perfect combinations with other features
- Portfolio Tracker – your entire asset list in one overview
- Stock Watchlist – monitor individual stocks efficiently
- ETFs & ETCs – track trend signals for funds
- Cryptocurrencies – manage highly volatile markets
- Gold & Silver – include physical holdings in your alerts
- Community Alerts – discover popular signals from other users
- News Analysis – understand the reasons behind price movements
- Asset Notes – store your action plan for each alert
- 200-day-moving-average – recognize long-term trends
Register for free and create alerts and notes tailored to your strategy.
Learn more about our fair pricing under Pricing.